The Dashboard provides a quick, at‑a‑glance snapshot of overall business activity in Boulevard, shown through two tabs: Overview and Production. The Overview tab highlights top‑selling products, sales trends for the past 12 months, top customers, outstanding accounts, and pending credit receivables, while the Production tab displays team or unit production charts with comparison and filtering options.
From the Business Tools menu, select  Dashboard. To view display first when launching the application, select Show Dashboard at startup in the lower left-hand corner of the form.
Tabs:
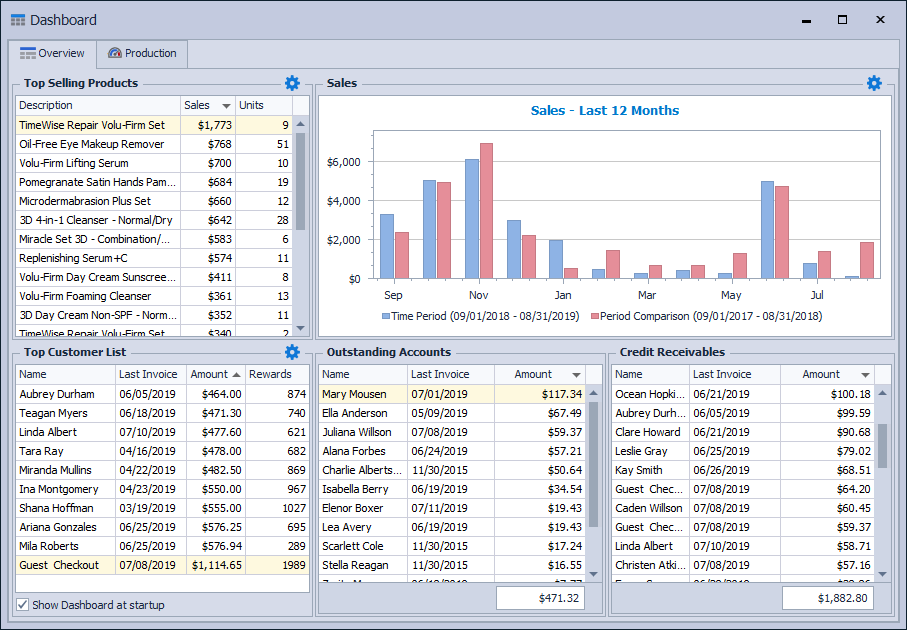
Overview
Tips:
- Exclude any customer from being displayed in the Top Customer List section by checking the option from their profile settings. View
- Double-click on a customer name or product description to open the corresponding profile.
- Choose how many Top Selling Products or Top Customers by clicking
 in the upper right corner of that section.
 - View Sales - Last 12 months as a Bar Graph or Line Graph by clicking in the upper right corner of that section. The chart displays a rolling 12 months with the current year (Time Period) in blue and the previous 12 months (Period Comparison) in red.
Production
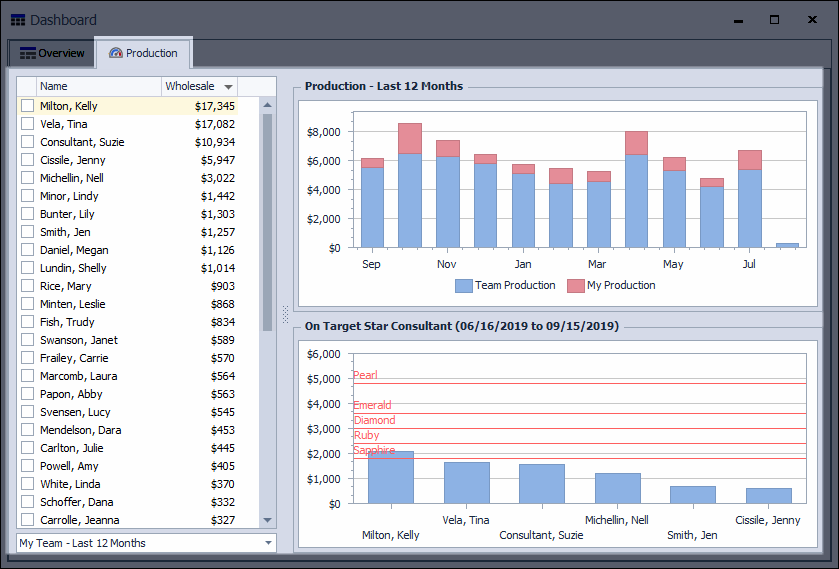
Chart Options (select from the drop-down menu):
- My Team
- My Unit
- All Units
- Last 12 Months
- Last 4 Seminar Quarters
- On Target Minimum Amount
Select a checkbox from the consultants in the left-hand pane (or multiple for comparison). Applicable consultants will then be shown on the Production chart to the right.
Note:
- The Production chart shows your unit's production along with your own. Your personal production information comes from inventory orders entered or production added to the unit list. View
- The On Target Star Consultant chart displays on-target consultants according to the criteria set from the drop-down menu.